|
Making a Complex Table
- To get some practice with a complex table, work through the steps in this section.
Requirements
You need
- the Chart.gif. graph which is located in this download zip file
- Your copy of NetObjects Fusion up and running.
Tips
- Print this document.
- Make a check mark next to each step you complete.
Producing the complex table
- Select File, New Site, Blank Site.
- Name the site Learning Tables.
- Click OK.
Fusion takes you to Site View.
- Select the Home Page.
- Press CTRL+N to create a new page.
- Name the new page Sales.
- Double-click the Sales page icon to open Page View.
Congratulations, you're ready to start building our table!
-
|

|
|
Figure 1 — Table Tool
|
|

|
|
Figure 2 — Table Border
|
|
Click the Table Tool (Figure 1).
- Click and drag to draw a table in the Layout.
- Set the table to 4 columns, 7 rows.
- Set the table border to 0 (Figure 2).
- Click and drag the first column right border to 80 px. from the left table edge.
- Merge all first row cells.
- In the merged cell, enter Our Sales by Region.
- Use Cell Properties, Text tab to set Style H1.
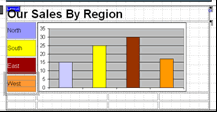
How are we doing so far? Your table should look like Figure 3.
|

|
|
Figure 3 — Table with H1 row
|
Making room for a chart graphic.
-
|

|
|
Figure 4 — Select Cells
|
|
Select all cells in columns 2-4, rows 2-5 (Figure 4).
- Right-click a selected cell.
- Select Merge Cells.
- Click the Picture tool.
- Click in the big merged cell.
- Browse to locate the chart graphic.
- Click OK.
Did the chart show up? Good job!
|

|
|
Figure 5 — Cell Properties, Background Colour
|
|

|
|
Figure 6 — Text Colour
|
|
Let's add some captions for the chart.
- Double-click the cell at column 1, row 2.
- Enter "North."
- Use Cell Properties, Cell Tab to set cell background colour Purple (#9999FF) (Figure 5).
- In column 1, row 3, enter "South".
- Set cell background colour Yellow (#FFFF00).
- In column 1, row 4, enter "East".
- Set cell background colour Maroon (#990000).
- Select East.
- Set text colour White (#000000) (Figure 6).
- In column 1, row 5, enter "West."
- Set cell background colour Orange (#FF9933).
Your page should look like Figure 7.
|

|
|
Figure 7 — Page with chart and coloured captions
|
Adding a secondary heading and some news items.
- Merge all cells in row 6.
- Enter Annual Meeting Excitement!
- Set Annual Meeting Excitement! to H2.
- In row 7, cell 2, enter The CEO's Speech.
- Press Enter to start a new paragraph.
- Enter Blah blah blah blather blah blah blather blah blah blather.
- Set The CEO's Speech to H3.
- In row 7, cell 3, enter The President's Speech.
- Press Enter to start a new paragraph.
- Enter Blah blah blah blather.
- Set The President's Speech to H3.
- In row 7, cell 4, enter The Shareholder Revolt!
- Press Enter to start a new paragraph.
- Enter Blah blah blah blah blather blah blah blah blah blather.
- Set The Shareholder Revolt to H3.
Decorating the news stories
|

|
|
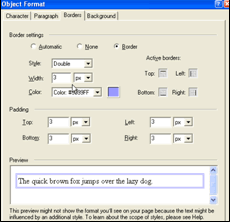
Figure 8 — Object Format
|
|
For a finishing touch, let's decorate those three "news stories" a bit.S
- Select the CEO's Speech cell.
- On Cell Properties, Cell Tab, click Format.
- Use Object Format, Borders Tab to set a Border, Double, 3 px, Purple (#9999FF) with all Padding set to 3 px (Figure 8).
- Select the President's Speech cell.
- Set a Border, Outset, 5 px, Maroon (#990000), all Padding 3 px.
- Select the Shareholder Revolt cell.
- Set a Border, Dashed, 5 px, Dark Blue (#003366), all Padding 3 px.
- Click Preview to examine the page.
Comparing the finished complex table
If your page looks like Figure 9, congratulations, we're done! (Don't worry about minor variations in text wrap or colour.)
Did you notice how you can change Borders and Padding for cells independently of the Table Properties? You can manipulate those settings (and more) on the Object Format dialog (Figure 8).
|
|
Beware – many of the settings on the Object Format dialog
- Require CSS to render in the browser, and
- Could be ignored or mangled by older browsers like Netscape 4.x.
|
|